Solar Activity and HF Propagation
|
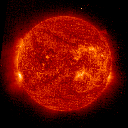
What's the sun up to? Sunspots? Flares? See for yourself.
|

Extreme Ultraviolet He II
NASA - Goddard
|
 Extreme Ultraviolet Fe IX
NASA - Goddard
|
 Soft X-Ray Telescope
Hiraiso - Japan
|
These are today's images, direct from NASA and Japan. Click for enlargements.
If the image says CCD Bakeout, click here to learn about that process.
|
HF Propagation Indicators
Maximum Usable Frequency Links
Planetary A Index of Geomagnetic Activity
- The above link should take you to the right place in the page. Look for:
V. GEOMAGNETIC A INDICES
OBSERVED AFR/AP date 3 digits / 3 digits
- OBSERVED is as opposed to estimated
- AFR is an African reading (represented by the first 3-digit number)
- AP (after the slant / -- the second 3-digit number) is the planetary average.
- A and K indices represent the current effects produced by solar particle radiation.
- A < 10 indicates a quiet ionosphere (good).
- A > 30 indicates a disturbed ionosphere (bad news / high signal absorption).
- The Boulder A index is also available from radio station WWV hourly at :18 on 2.5, 5 and 10 MHz.
Planetary K Index of Geomagnetic Activity
- This bar graph shows the most current indicator of geomagnetic disturbance.
- The A and K indices are related, but the K index will be a more up-to-date indication.
- For the K index, lower is better and zero is great.
- The Boulder K index is also available from radio station WWV hourly at :18 on 2.5, 5 and 10 MHz.
Solar Flux (2800 MHz / 10.7 cm wavelength) in text format
- from Dominion Astrophysical Observatory, Penticton, B.C.
- Solar flux ranges from about 65 to 300, and 65 is bad news.
- 10.7 cm solar flux can also be obtained from radio station WWV hourly at :18 minutes on 2.5, 5 and 10 MHz.
- Click here to see a graph of solar flux values over the last five sunspot cycles.
Solar Flux (X-Ray wavelength) graph (Today's Space Weather)
- Updated every 5 minutes, this graph shows flares (represented by X-Ray flux) and their classes (C, M, X, etc.).
- Orders of magnitude of solar flares are represented by the letters A (lowest), B, C, M and X (highest intensity).
- Big spikes in the graph = flares = big trouble 18 to 36 hours later (ionospheric storm likely).
- This graph cannot be displayed as part of this page (URL changes 120 times per day).
WWV Propagation Reports (from DX Summit)
The format is as follows:
- Date (UTC)
- Callsign of amateur reporting
- Time (UTC)
- SFI = Solar Flux Index
- A Index
- K Index
- Prediction of solar activity for next few hours
- Prediction of level of activity of earth's geomagnetic field (quiet's better than active)
HF PROPAGATION LINKS
- American Radio Relay League
- Australian Ionospheric Prediction Service
- Dominion Radio Astrophysical Observatory (Canada)
- George Jacobs and Associates
OTHER RESOURCES
For the amateur who would like to go more in depth on the subject of HF propagation, prediction and interpretation of data available from numerous sources, the webmaster recommends The NEW Shortwave Propagation Handbook. CQ magazine offers the book for about $19.95. It is written by George Jacobs, W3ASK and Dr. Ted Cohen, N4XX. George Jacobs has for several decades written the monthly propagation column in CQ.

[email protected]

modified 9/23/06
|


